10-Year Treasury Hits 5% While the Fed Hikes Rates

Updated: 3 minutes ago
The big story this week is the 10-year Treasury finally hitting 5%, pushing mortgage rates above 7% and increasing borrowing costs across the economy. The other big story is the Fed hiking interest rates for the first time since 2023. In this Market Insights video, we cover why we believe the hike was a mistake and look at the inflation data behind our view.
We also look at some of the selloffs that have occurred from August through October over the last eight years, and how well the market has typically performed after those pullbacks in November and December. Lastly, we check in on S&P 500 earnings, foreign investment in U.S. stocks, and Bitcoin.
Video Recap
The full breakdown in written form
The 10-Year at 5%
The 10-year Treasury reached 5% on September 15. For most of the last four years the yield ran into a lid in the 4.65% to 4.70% range and turned back every time it got there. It cleared that lid a couple of weeks ago and went almost straight to five.

We flagged long-term rates pressing toward 20-year highs in our September 3 update, and the move since then has been quick.
Housing is where this lands first. A 30-year mortgage is now 7.2%, up from just under 7% a few weeks ago, and the freeze in existing-home sales has deepened along with it. Corporate borrowers feel it too, since new bond issuance is priced off the 10-year, so anything a company finances this quarter costs more than it did last quarter. The group this helps is savers and anyone putting new money into bonds, who are being offered yields they have not seen in two decades.
October 2023 is the comparison I keep coming back to. Rates touched 5% for a few days then and fell substantially over the following two months. We would like to see that repeat. Whether this is the peak or a waypoint is not something anyone knows today, and it is worth watching closely, because the 10-year reaches into the economy, the bond market and parts of the stock market all at once.
The September Hike
The Fed raised rates at the September meeting, its first hike since 2023, and the market had it nearly fully priced by the day before. Market-implied odds from the CME FedWatch Tool put a September hike at 33% a month earlier and 93% on September 15.

Expectations for what follows moved just as far. The odds that the fed funds target ends the December meeting at least 50 basis points above today's level went from 22% a month ago to 79%.

Oil is the reason, in our view. Crude crossed $100 a barrel, prices at the pump followed it up, and headline inflation turned back up with them. The hike itself moves the overnight rate, which passes through quickly to credit cards and home equity lines.
What the Inflation Data Shows
I do not think this was the right call, and the data is the reason.
Headline CPI is running 3.4% year over year. It spiked to 4% after the conflict in Iran began and has come down since. Core CPI, which strips out food and energy, is 2.4%, the lowest reading since early 2020. The measure the Fed is supposed to weight most heavily is not going up.

Average hourly earnings are growing 3.1% year over year, down steadily from a 6% peak in 2022. Wage growth of 4% or 5% and higher is what the Fed worried about four and five years ago. Nothing in this series hints at a turn.

Home prices are up 1.52% from a year ago. That is a different world from the 21% year-over-year increases of the post-COVID period, when housing was one of the loudest inflation inputs in the data.

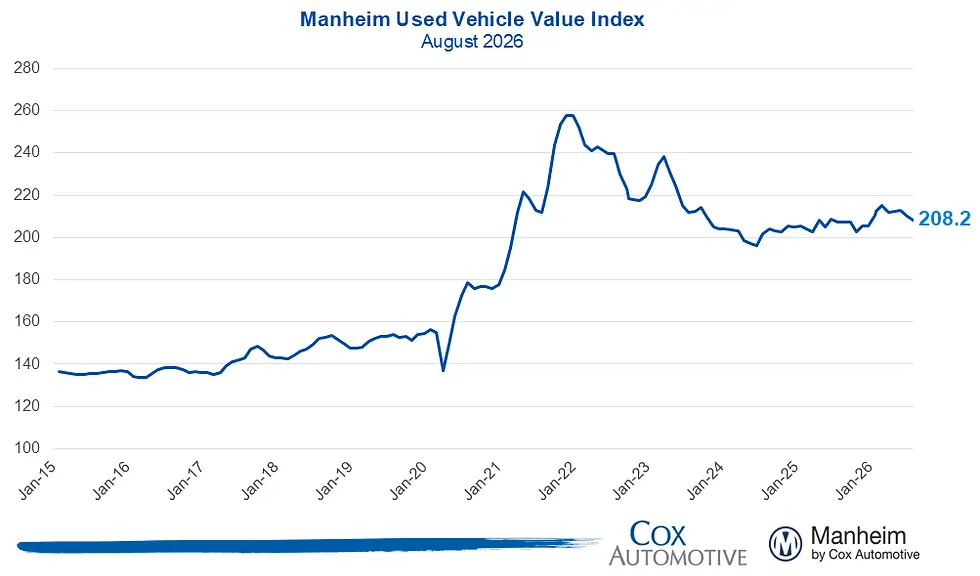
Used vehicle prices have gone nowhere for three years. The Manheim Used Vehicle Value Index read 208.2 in August, inside the band it has held since 2024, after the chip shortage pushed buyers into the used market and sent the index to a record in early 2022.
Companies have stopped talking about it too. In the first quarter of 2022, 410 S&P 500 earnings calls cited inflation. The most recent quarter had 205. Executives raise what is squeezing them, and this has been falling off that list for four years.

Prices are still 40% to 60% above where they were five or six years ago, and households feel that at the register every week. Monetary policy acts on the rate of change rather than the level, and in nearly every category the Fed watches the rate of change is flat or falling. A hike also does nothing to the price of a barrel of oil, which turns on when the war ends. The best outcome from here is that the committee stops at one rather than repeating the move in December, and that is what we are watching into the fall.
Fall Pullbacks and What Followed
This has been a year where the third month of each quarter is the weak one, and September is running to form. The August through October window has been rough in seven of the last eight years. The table below shows the largest peak-to-trough decline inside each of those windows rather than the three-month return.

Those drawdowns average 7.93%. 2025 was the outlier at 2.98%. 2022 dropped 16.91% and 2018 dropped 9.88%, and both were midterm years. 2026 is a midterm year, so a 7% to 9% decline from here would be ordinary rather than a signal.
The right-hand column is the more useful one. November and December returned 4.48% on average across those eight years. 2018 is the exception at negative 7.18%, and that quarter had a specific cause, which was a new Fed chair spooking the market with a hike cycle. 2022 came in roughly flat at negative 0.49%. Every other year was positive.
Third-quarter earnings season starts in mid-October. Earnings have carried this market all year, and getting to those reports counts for more than the next few weeks of price action.
Now for Rapid Fire
Earnings. Consensus estimates put S&P 500 operating earnings at $363.71 per share for calendar 2026, against a final $271.29 for 2025. The estimate for this year started around 10% to 11% growth and is now running near a third higher than last year. 2027 sits at $419.54 and is still climbing. Earnings drive prices over long stretches more than anything else does, and these lines are pointed up and to the right.

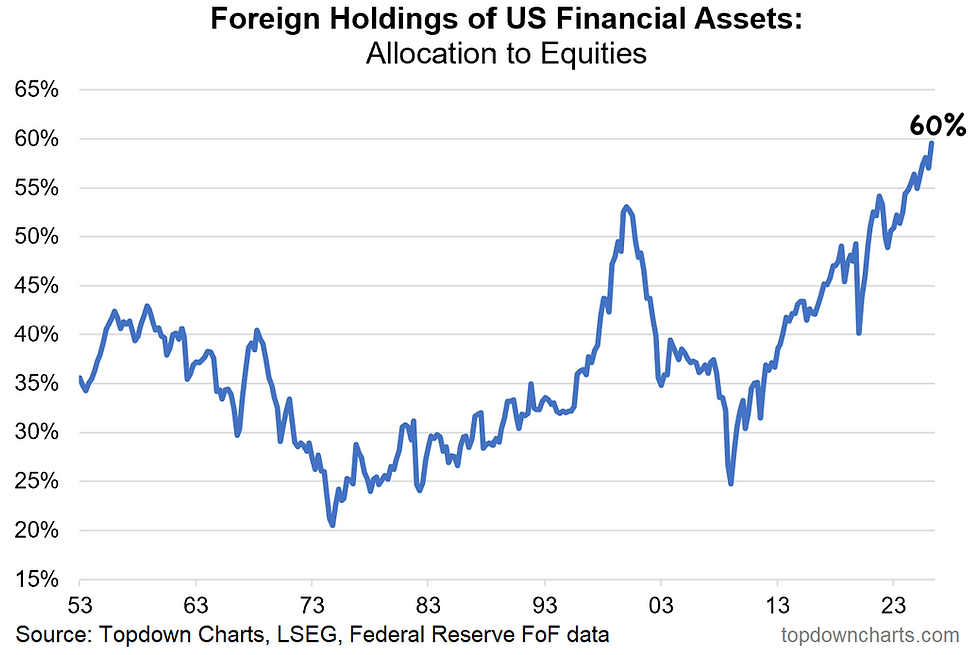
Foreign demand for U.S. stocks. One of the louder stories of the last eighteen months has been foreign investors leaving U.S. markets. Foreign holdings of U.S. Treasuries sit above $9 trillion, near a record, which already argued against it. On the equity side, 60% of foreign investors' U.S. financial assets are now in stocks, the highest share in data going back to the 1950s.
Bitcoin. Bitcoin fell from a peak of $125,000 to roughly $60,000 earlier this summer, held that level, and has climbed back to $76,812. Day-to-day volatility has come down from what it ran through most of its history. Interest tends to arrive after a long move higher rather than after a 50% decline, which says more about investor behavior than about the asset.

Have questions about how this affects your portfolio?
Digging past the headlines to the data underneath is the kind of analysis we bring to every Sentara Capital client relationship. If you'd like to talk through what these numbers mean for your specific situation, we'd welcome the conversation.
Contact Us at (770) 509-5305 to Begin Your Journey
FAQ: Rate Hikes and a 5% Treasury Yield
What does core CPI leave out, and why does the Fed watch it?
Core CPI excludes food and energy, the two categories driven most by weather and by oil supply. The Fed leans on it because monetary policy acts on demand over roughly 12 to 18 months and can do nothing about a supply shock in either category. Headline CPI is what a household actually pays, so both readings matter, for different reasons.
Can a Fed rate hike bring gas prices down?
Not in any direct way. Higher rates slow borrowing and demand over about a year, while the current move in crude comes from supply risk tied to the conflict in Iran. Oil falls when the supply picture changes, whatever the fed funds rate happens to be.
How does the 10-year Treasury set mortgage rates?
A 30-year mortgage is priced at a spread over the 10-year Treasury, usually somewhere between 1.5 and 3 percentage points, because lenders sell those loans into the mortgage-backed securities market where the 10-year is the benchmark. The Fed sets the overnight rate instead, which is why a Fed move does not pass straight through to a mortgage quote. A hike at the short end can push long yields in either direction depending on what it signals about growth.
Is a 5% Treasury yield good or bad if I am retired?
It depends on which side of your balance sheet it lands. New money put into Treasuries earns more than at almost any point in the last twenty years, while bonds and bond funds already owned lose price value as yields rise, and any borrowing costs more. There is no single answer that fits every household, which is why we run it against actual income needs rather than applying a rule of thumb.
Why is September usually weak for stocks?
There is no mechanical cause, and it is worth saying so plainly. The usual explanations are thin late-summer liquidity and mutual fund fiscal year-end selling that runs into October. It is a tendency in the data rather than a rule, and 2025 broke it.
Another question? Call (770) 509-5305.
Click for Full Transcript
In today's market update, we are going to check in on the stock market and take a look over the last eight years at some of the challenges the market has had in the August through October time frame, and also at what happened after that in November and December. Then on interest rates, the 10-year Treasury finally hit that 5% number we have been talking a lot about over the last few months. And we now have the Federal Reserve hiking interest rates again for the first time in quite a while. We have that and more. Let's dive into it.
Before we get into the market update, just to thank you, we just hit 7,000 subscribers. And to think just a couple of years ago we were aiming for 100 subscribers. Now we're at 7,000 on the way to 10,000. Thank you very much. We definitely appreciate it.
Well, let's take a look at the stock market, because what we've seen this year is that when we've been in the third month of a quarter, so March and June and now September, the stock market has not performed that well. And then once it gets into a new quarter and we get earnings season again, the markets have done extremely well during that time. So it isn't that surprising here in September that the market is struggling a little bit.
We haven't had a big sell-off yet, but we've seen challenges in the August to October time frame going back over the last eight years. What you'll see on the screen in red, this column, we are looking at the biggest sell-off that occurred during that three-month period. So this is not the actual return for three months. This is, hey, there was a sell-off somewhere along the way. How far did the market drop? That's what we're looking at.
You can see 2025 was an outlier. Only a 3% decline from top to bottom during that time frame. Every other year you've been very close to 5% or worse. And there have been a couple of really tough years. 2018 down 10%. 2020 down 9.5%. 2022 down 17%. 2023 down 10%. Now I'll point out here, we are in a midterm year. 2018 was a midterm year and 2022 was too, and both of those were tough. So don't be surprised if we end up seeing a 7, 8, 9% sell-off by the time it's all said and done here.
And if that happens, what does that mean for the end of the year? Look on the far right. You'll see 2018 was a minus 7%. Not good for those last two months. That was a much different year, because Jerome Powell, at the time a new Fed chair, had spooked the markets with a rate hike cycle and it caused a 20% decline in the stock market in the fourth quarter from top to bottom. But since then, in those last two months, you can see the markets have done very well. 2022 was basically down a half a percent, not much gains then, but the rest of the years are up, and on average the market's been up just shy of 5% in those last two months.
So listen, what's really important to understand now as we look toward the rest of the year: once we get into mid-October, that's when we're going to get a new earnings season for the third quarter. And as we've talked about a lot here over the last year, earnings reports have been incredible all year long. So we just need to get to that mid-October level and then let earnings take over. Until then, don't be surprised if we see further selling. Don't be alarmed. It's something that has been happening regularly over the last eight years.
Now let's shift gears and talk about interest rates. This has been a hot topic, no doubt. And one of the reasons for that is that over the last three, four months we have been talking about 5% as an interest rate on a 10-year Treasury. Would we eventually get there? You can see this chart, and this is over the last four to five years. There has been a lid up at the top in the 4.65% to 4.70% range. We broke above that a couple of weeks ago and have raced right up to five.
And as we're filming here on September 15th, we hit 5%. This is not ideal by any stretch, but we are at the exact same level we were in October of 2023 for just a few days. We went up and touched 5%, as you can see there, and then rates went down significantly over the next couple of months. That's what we hope happens again here. We'll just have to see what plays out.
But the impact on this is most evident in the housing market, where a 30-year mortgage is now up to 7.2%. That is very high, and that has housing in a freeze as we have talked about. It's even in more of a freeze now than it was even a few weeks ago when rates were just under 7%. Higher rates on the 10-year also impact how much companies have to pay if they go issue bonds. So this is not ideal, to see the 10-year up here at five. Time is going to tell again whether it continues to go up or reverses and goes lower. We'll be watching closely, because this definitely has an impact on the economy, on the bond market, and it impacts stocks to one degree or another depending on which part of the market we're looking at.
All right, let's do part two. We're talking about interest rates and the Federal Reserve. Like I said, we're filming this on the 15th of September. By the time you see this video on the 17th, the Fed likely hiked interest rates on Wednesday. And things have changed a lot here in the last month. As you can see there, one month ago the odds the Fed would hike in September were just 33%. Now it's at 93%. And again, that might as well be 100% in most people's opinion.
And if you go a step further and say, okay, what happens after this? What's the Fed going to do after this? Well, if we look at what the odds are by December that the Fed has hiked twice, you can see again one month ago, 22% chance, just one in five odds. Now it's four in five odds, basically 80%. So the market is saying there's going to be at least two rate hikes, and again this has been a big change from a month ago.
Now why has that happened? Let's get into that. So in our opinion, one of the biggest reasons the Fed is hiking interest rates now is oil prices. They just crossed over $100 a barrel. Prices at the pump have gone up, up and away over the last couple of months. And as a result of that, it has fueled the concern about inflation.
So let's take a look at some data, because we want our opinion to be known here that we don't think the Fed is making the right decision. We don't believe they should be hiking interest rates. We're going to show you why.
Let's start off by looking at CPI, the consumer price index, and core CPI, which basically strips away energy and food. Yes, people have to spend there, but I'm going to get to why this is important in a second. This is going back over the last 10 years. It's looking at year over year how much prices have gone up. And what really stands out, of course, here is 2021 and 2022, the huge spike in inflation that we had back then. Then you had those numbers start to come down. And it's only been since the conflict in Iran that the orange line has spiked back up. It hit 4% and then has dropped down to 3.4%.
And that's not ideal, but that's driven really because of oil prices. That's the biggest factor. Because if you take that out, and food, look at the core number. This is the one the Fed's supposed to pay more attention to. The core is 2.4%, which is the lowest number that we've had since early 2020, meaning this number isn't even going up. And these are the factors that the Fed gets worried about. Because here's the question we have to ask. This Fed rate hike, what impact is that going to have on oil prices? It's not going to have any impact. This is totally reliant on when the war is going to end, which none of us obviously know. And so we don't think the Fed's hike is going to impact this bottom line.
Now let's get more data that backs up our point. Another one of the factors that led to inflation spiking back four or five years ago was average hourly earnings, wage growth. When this is 4, 5% or higher, they get concerned that it's going to cause more inflation. And you can see that this has also been steadily going down, just like that core CPI number. 3.1%, meaning the average hourly earnings right now are a 3% increase over last year at this time. And again there is no hint here that this is turning and going higher.
Now we have another chart that looks just like this, and these are home prices, which were a huge problem four or five years ago. You can see this got as high as 20% year-over-year increases in the post-COVID period, but right now it is at 1.5%, meaning home prices have barely budged versus where they were last year at this time.
Next chart, used car prices. Most people who had to buy a car in 2021, 2022, 2023 remember that new car lots were empty. There weren't enough chips to make the vehicles. So because people could not find new cars to buy, they started buying used cars. There was a rush for them and it sent prices skyrocketing. You can see that there. This is called the Manheim Used Vehicle Index. But take a look over the last three years. Used car prices have flatlined. They have not been going up.
And so when you start to add these key categories up and say there's no inflation in a lot of these categories, why is the Fed hiking? Now, one thing that I want to mention there: prices are much higher, 40, 50, 60% higher today than they were five or six years ago. So we understand price levels are still really high. The question here is what's the rate of change, and that's where we have a problem with what the Fed is doing.
Now the last chart we want to talk about here is the number of companies in the S&P 500 who on their most recent earnings call mentioned the word inflation. Because once again, this spiked, went straight up in the early COVID period, and ended up being over four out of every five companies. But this has also been kind of steadily going lower. When companies and executives don't feel like it's something worth mentioning on the call, that is not a major concern for the Fed, in our opinion.
So listen, the bottom line is it's already done by the time you've seen this. We've had a hike at this point. What we can best hope for is that they don't make a mistake and do it again later this year.
Now it is time for rapid fire. This is when we go over some key charts we think you need to see. We're going to start out looking at earnings per share for the S&P 500. Here's the key thing you need to know. From 2024 to 2025, earnings went up nicely. But from 2025 to 2026, you can see things have rocketed higher right now. For 2026, expectations are $363 of profit. They were at $271 last year. That is a big increase in earnings expected for the full calendar year. Just remarkable. At the start of the year it was expected to be around 10, 11%, somewhere in that range. So this is remarkable. And 2027 is another big jump, you can see there. And the key thing is the shape these lines are taking, up and to the right. It's been that way all year long. This is what drives stock prices the most in the long term. So this is what you want to see right now for sure.
All right, next chart. One of the storylines over the last year, year and a half, is that foreign investors are getting out of the stock market. They're selling their U.S. Treasuries, etc. We've had a chart we've shown here a couple of times that foreign holdings of U.S. Treasuries are over $9 trillion, right near an all-time high. So it is not the case that they have been selling en masse and taking out their money. Well, it looks like they like U.S. stocks even more.
Now this chart goes back actually to the 1950s, and it's saying, for foreign investors, of the money they have in the U.S., what percentage of it is in U.S. stocks? And look at that. Over the last 10 years it's steadily been going higher and just hit 60%, the highest number ever, meaning foreign investors have an appetite for U.S. stocks. And with the growth that companies have, and the earnings growth in particular, who can blame them?
All right, the last chart here. We're talking about Bitcoin. And we're talking about this because you're not hearing about Bitcoin many places right now. Earlier in the summer, Bitcoin had hit $60,000 per coin, down from a peak of $125,000, a bigger than 50% sell-off. And we pointed out that if you loved Bitcoin above $100,000, you should really love it now, down 50%. But that's not the way it works. When it has had a huge run higher and a mania starts to exist, that's when we start getting calls and that's when investors start putting more of their money in. $60,000 was a big line in the sand, and you can see that it held that number and has now steadily been rising. It's just shy of $80,000 now. So there's a lot less volatility in Bitcoin today than there was for most of the years prior.
All right, so our key takeaway is that if the stock market continues to go sideways to lower over the next month, month and a half, don't be afraid. That is not unusual at this time of year. And like we looked at with the earnings picture, it has never been brighter. Also on interest rates, the 10-year Treasury has hit 5%. The big question now is, will this be the peak like it was in October of 2023, or is it going higher? We will have you covered in the future.
Listen, if you are new to Sentara Capital, this is important for you to understand. What we do is we take the information we're talking about today and we figure out what we are doing with client portfolios to help them best get through this period, and honestly to look for buying opportunities if the sell-off accelerates. If you're not getting that kind of advice from your advisor, and if you're not getting these kinds of educational YouTube sessions, head on over to our website and reach out to us via the contact page. We can get on the phone and have a conversation and see if we are a good fit. Well, thanks for watching and take care.


Comments