2026 Midyear Update: Stocks Up, Small Cap Comeback, Silver Mania Ends

Updated: Jul 28
We're halfway through 2026, and it's been full of action. In this update, we break down the first half, and what to watch in the second half.
In this video:
▪ S&P 500 up 9.5% at midyear despite a 10% drop earlier in the year due primarily to the Middle East conflict.
▪ Small caps surge 22%, outperforming large caps for the first time in over five years.
▪ The Mag 7 shocker: down 2.5% while the QQQ gained nearly 20% powered by the chip boom.
▪ Silver's mania ends: dropped 53% from its January peak, and why gold pessimism may signal opportunity.
▪ Q1 earnings crushed expectations (28.5% growth vs. 13% projected), with Q2 estimates rising.
▪ Oil's volatile ride from $57 to $115 and back to $70.
▪ Jobs market turnaround: 111K average monthly gains and no sign of significant AI-driven layoffs.
▪ SpaceX IPO update, plus OpenAI and Anthropic IPOs still to come.
▪ A story on why a risk tolerance questionnaire alone shouldn't set your portfolio.
Video Recap
Prefer to read instead of watch? Here's the full breakdown
The Magnificent Seven fell 2.5% while the Nasdaq 100 gained nearly 20%
The S&P 500 finished the first half up 9.5% and the Dow up 8.7%. Neither number is the real story. The story is that the Magnificent Seven, the seven mega caps that have carried this market for most of a decade, ended the half down 2.5%, while the Nasdaq 100 gained 19.9%. If you had told us in January that the Mag 7 would be negative at midyear, we would have guessed the broad market was negative too. It went the other way, and it did so through a nearly 10% drawdown in the first quarter tied to the Iran conflict.
The gap came from memory and storage chips. AI infrastructure needed far more of them than analysts had modeled, and pricing power followed. Micron and Western Digital posted gains in the 200% to 300% range in six months, with earnings to match. That flows into real prices: Apple raised Mac prices roughly $300 a unit on the back of chip costs. Leadership in this market has broadened well past the household names.


Small caps broke a nine year losing streak with a 22% first half
The Russell 2000 gained 22.05% in the first half, ahead of every large cap index on the board. That is a genuine break in trend. Large caps had beaten small caps in eight of the last nine years, and the last five were close to a rout. Going back 20 years, when small caps start to outperform, they have tended to keep outperforming for years at a time rather than for a quarter or two. Whether this is the start of that kind of cycle is one of the more interesting questions for the back half.
The silver mania ended, and gold sentiment swung to the opposite extreme
Silver is down 53% from its January peak. We called that move a mania while it was happening: it was parabolic, it was straight up, and the hype had reached the point where the crowd was certain it could only keep going. Most of the money went in late, which is what made the unwind so painful. Silver finished the half down 17% year to date and gold down 7%, and those figures understate how violent the round trip was for anyone who bought the top.
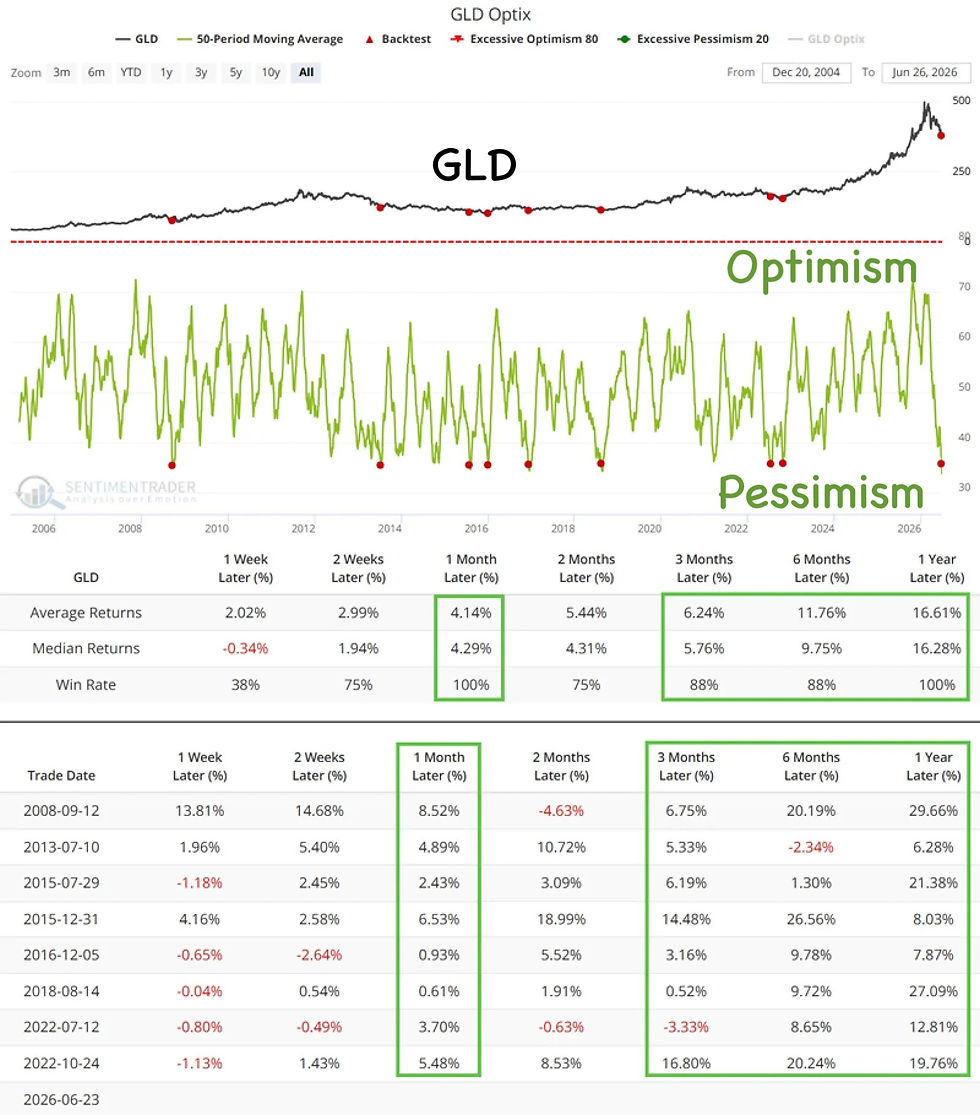
Gold sentiment has now flipped to the other extreme. Investor pessimism sits at one of the lowest readings in 20 years of data, matching seven or eight prior occasions since 2006. After every one of those, gold was higher a month later and higher a year later, with an average one year gain of 16.6%. History is not a forecast. But when the entire crowd is standing on one side of a trade, the other side is usually where the opportunity sits. SpaceX is running the same emotional script in real time: it priced at $135, spiked to $225 in the first week as buyers who missed the allocation crowded in, and sits near $151 today.

First quarter profits grew 28.5% when analysts had forecast 13%
Earnings are the engine under this market. Analysts entered April expecting 13% profit growth for the S&P 500 in the first quarter. Actual growth came in at 28.5%. Tech led at roughly 50%, but this was not a tech only story: industrials, financials, and consumer discretionary all grew 20% or better. The breadth is what made it remarkable, and it is what most forecasters missed.
Second quarter reports begin in mid July, and the consensus now looks for 23% year over year growth, up from the 16% expected in January. Profits compounding at that pace are the single strongest argument for stocks finishing the year meaningfully higher than they sit today.
Oil round tripped from $57 to $114 and back to $71, and the 10 year sits at 4.48%
WTI crude opened the year in the $57 to $58 range, spiked to $114 during the Middle East conflict, and has since collapsed back to about $71. Two months ago, oil analysts were arguing crude would hold in the $80s and $90s for the rest of the year even after the conflict cooled. It did not. That drop removes the largest inflation pressure point of the first half.
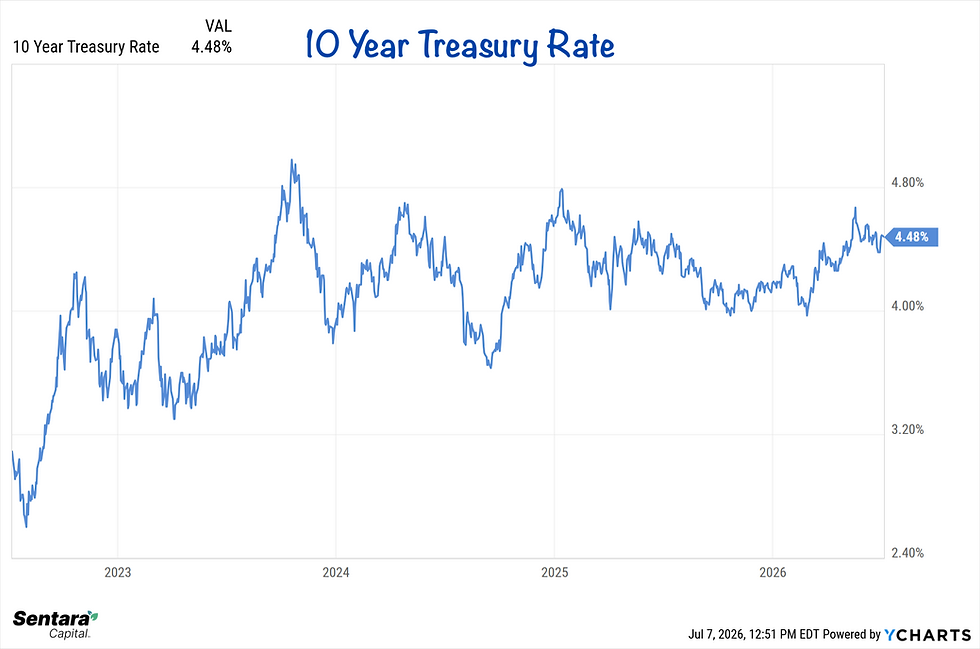
The 10 year Treasury is the tougher story. It sits at 4.48%, still inside the 4% to 4.6% band it has held for a year and a half. A break below 4% would lower corporate borrowing costs and pull mortgage rates down with it. At 6.5%, the 30 year fixed mortgage is the reason housing has had a hard year. Which way the 10 year breaks is one of the two or three variables that will decide the second half.

The jobs market turned in March, and the AI job loss story is not showing up in the data
From July 2025 through February 2026, the three month average of monthly job gains spent more time negative than positive. That is a hard labor market, and it was the defining economic frustration of last year. It turned in March. The three month average now sits at 111,000 jobs a month, comfortably above the 50,000 that many economists treat as break even. Layoffs are not happening either: initial jobless claims came in at 215,000 last week, inside the 190,000 to 260,000 range they have held for three years.
Unemployment is 4.2%, roughly its two year average. So far, nothing in the data suggests AI is driving layoffs, and the firm level research points the other way. Companies in the top third of AI spending increased headcount by 10.2% after adopting, and increased entry level hiring by 12%. Low adoption companies showed essentially no change on either measure. We are in the camp that AI leads to more prosperity rather than mass unemployment, and the early evidence supports that view.


Diane's story: a risk tolerance questionnaire is not a financial plan
Risk tolerance questionnaires are standard practice across our industry, and they carry a structural flaw: the answers depend on what markets did recently. Ask someone right after a 40% drawdown and you get a different person than you get at an all time high. That is a poor foundation for a decision that will shape the next 30 years.
A prospect we will call Diane came to us at 62, planning to retire at 67. She needed about $5,000 a month, with $1,700 from Social Security and $1,300 from an airline pension, leaving a $2,000 monthly gap for her portfolio to cover. Years earlier, another firm had asked her a couple of questions. One was whether she considered herself a risk taker. She said her friends thought she was. They put her in 100% stocks. Her $500,000 became $260,000 in the 2008 selloff, a 48% decline.
The math is the point. At $500,000, her portfolio could safely support roughly $2,083 a month. At $260,000, it supported about $1,040. Her $2,000 gap became a $1,000 shortfall with no realistic way to close it before retirement. A questionnaire produced that allocation. A plan would not have. We start with assets, future income sources, and actual spending needs, adjust for inflation, and solve for the rate of return the plan requires. The allocation falls out of that, not out of a personality quiz.


Key takeaways
The S&P 500 gained 9.5% and the Dow 8.7%, but the Magnificent Seven finished the half down 2.5% while the Nasdaq 100 gained 19.9%
Memory and storage chipmakers drove the Nasdaq's gain, with Micron and Western Digital up 200% to 300% as AI demand outran supply
The Russell 2000 gained 22%, breaking a stretch in which large caps beat small caps in eight of the last nine years
Silver fell 53% from its January mania peak, while gold sentiment now sits at 20 year lows, a reading followed by gains 100% of the time one year out
First quarter earnings grew 28.5% against a 13% forecast, and the second quarter is tracking 23%, up from 16% expected in January
Oil fell from a $114 peak to $71, while the 10 year Treasury holds at 4.48% and 30 year mortgages sit at 6.5%
Job gains turned positive in March and now average 111,000 over three months, and high AI adoption firms grew headcount 10.2% and entry level hiring 12%
Have questions about how this affects your portfolio?
A first half like this one rewards investors who can tell a durable trend from a crowded trade. That kind of perspective is what we bring to every Sentara Capital client relationship. If you'd like to talk through what these numbers mean for your specific situation, we'd welcome the conversation.
Contact Us at (770) 509-5305 to Begin Your Journey
FAQ: 2026 Midyear Market Update
How did the stock market perform in the first half of 2026?
The S&P 500 gained 9.5% and the Dow gained 8.7% through midyear, despite a nearly 10% drawdown in the first quarter tied to the Middle East conflict. The Nasdaq 100 gained 19.9% and the Russell 2000 gained 22%. The Magnificent Seven, by contrast, finished the half down 2.5%, which means the gains came from outside the largest names.
Why did silver crash in 2026?
Silver rose parabolically into a January peak on heavy retail buying and euphoric sentiment, then fell 53% as that momentum reversed. Manias of that shape tend to unwind quickly, and the buyers who entered near the top absorbed most of the damage. Silver finished the first half down 17% year to date.
Is AI causing job losses?
The firm level data does not show it. Companies in the top third of AI spending increased total headcount by 10.2% and entry level hiring by 12% after adopting, while low adoption companies showed no meaningful change on either measure. Unemployment sits at 4.2% and initial jobless claims are at 215,000, both consistent with a stable labor market.
What should investors watch in the second half of 2026?
Three things stand out: whether the 10 year Treasury breaks below 4% and pulls mortgage rates down with it, whether second quarter earnings deliver the 23% growth now expected, and whether small cap leadership holds. The IPO calendar also has OpenAI and Anthropic expected later this year, following SpaceX.
Have a question we didn't cover? Call us at (770) 509-5305.
Click for Full Transcript
We are halfway through the year, amazingly. So it's time for our midyear update. We're going to be looking at stock market performance in the first half, interest rates, some wild moves in the precious metals space, jobs, and of course, SpaceX. We've also got more. Let's dive into it.
It has been a good year so far for much of the stock market. When we came into this year, we were off three straight years of gains. It had been a very good stretch, and there were a lot of questions on whether the markets could make it four years in a row. Our 2026 outlook was entitled "The Case for a Good Year." We made the case for why it should do well, but you never know exactly what the market is going to throw at you. On the screen here, you see the S&P 500 is up 9.5% through midyear, and it didn't go that way in a straight line. March was a very challenging month. The Iran conflict in the Middle East led to a lot of volatility. In fact, the stock market dropped almost 10% from top to bottom in that first quarter, with most of the decline happening in March. But buyers came in in late March, even before things were settled over there, and we had a tremendous rally in the S&P 500 from that point until late in the second quarter. June was a little volatile, but 9.5%, we will take it.
Not only that, the Dow Jones Industrial Average is up 8.7%. Nice to see there. But this is the biggest shocker, these next two numbers. The QQQ, which is basically the Nasdaq 100, where the biggest tech names mostly are, was up almost 20% in the first half of the year. Now, that hasn't been unusual. The last 10 years, tech has done very well. We have had a heavy overweight to tech here in our firm. But the big surprise is that the Magnificent Seven, which are the biggest seven companies, Nvidia and Google are in there, Microsoft, Meta and so forth, are down 2.5%. This is a shocker. If you had told me, or anyone in the financial world at the start of the year, that midway through the year the Magnificent Seven as a group would be down 2.5%, and asked what the rest of the market would be doing, we would have probably said negative. But it has not worked out that way. A 20% gain in the QQQ trust.
And the big reason for that is the chip sector. Memory and storage chip makers had a field day, because AI needed a lot more of those chips than a lot of analysts thought. So you had companies like Micron and Western Digital take off and have 200% and 300% gains in the first half of the year, and earnings skyrocketed. Which, by the way, these companies are charging a whole lot more for their chips. If you've recently gone out, like my oldest son, to buy an Apple computer, a Mac, those prices just went up $300 apiece as a result. So there are real life implications of these chip prices going up so much. That group really brought the QQQ trust, the Nasdaq 100, up so much.
Now the next item here, the Russell 2000. This is small caps leading, a 22% gain in the first half. This is amazing, because for the last five years small caps have gotten obliterated by the S&P 500 and anything large cap related. In fact, coming into this year, large cap had outperformed small cap eight of the last nine years. But that's not the case so far. 22% for small cap, 9.5% for large cap in the S&P. That is a big winner for small cap. And that is good, because typically, if you go back 20 years, when small caps have started to outperform, they tend to outperform for years at a time. So that could be real good news for the future hopes of small cap to do well.
All right, that brings us to gold and silver. Listen, normally we wouldn't highlight them in a midyear update, but we're doing it because if you look on the far left, in gold color, and in green, which is silver, those two were an absolute rocket ship for a lot of 2025 and then especially in January of this year. Anyone who was in that trade for over a year did very, very well. But most of the money went into silver and gold in January, and late January at that. We had a video, we'll put the title up there, but basically we said, for silver especially, this looked like a mania. It was a parabolic move. It had gone straight up, and there was so much hype and euphoria, which normally does not mean good things ahead. And lo and behold, from that time until now, silver is down 53%. It has gotten torched. The problem is a lot of people who bought silver at that time thought it was only going to continue going up. They have found out the hard way that is not the case.
Now let's talk a little bit about sentiment and emotion, because there are two things I want to share with you. The first is on gold. Now the opposite is the case. There is very much negativity around it, which to us means there could be opportunity. This is a chart that looks at the sentiment of gold investors, and this goes back to 2006. There you can see the red dot. We are at one of the lowest levels, meaning investors are very pessimistic right now. And if you look, there are seven or eight other occasions over the last 20 years when gold has had the level of pessimism it has right now.
So the question is, when everybody is super negative, what has gold's return been looking forward? That's what this is telling us. Down near the bottom, you'll see in the green box, one month later, a gain every time. Every occasion, one month later after this level of pessimism, gold has gone up. And then on the far right side, one year later, 100% of the time gold has been higher, on average a gain of 16%. So listen, if you have been wanting to invest in gold for a while and somehow you didn't earlier this year when there was a lot of excitement, now is definitely a good time to take a look and see. This makes the case that it could have very good performance in the year ahead.
Now the second thing about sentiment and emotion that I want to talk about is as it relates to investing portfolios and planning for clients. There is a big trend in the investment world and the financial planning world, which is what we do here in metro Atlanta, of risk tolerance questionnaires, where basically someone gets asked how they feel. It gives different scenarios, letting them know whether they are a bigger risk taker or not. The issue is that a lot of times the answers depend on how the markets have been doing recently. If you give that after a big 30% or 40% selloff in the market, that person is going to answer much differently than if the market's at all time highs.
We had a client of ours who, when we first met, when they were a prospect, came in, and I'm going to give you some of the numbers, because this is very fascinating. Her name was Diane. We've changed the name, of course. At the time she was 62 years old. She said she wanted to retire at 67. She thought at the time she was going to need about $5,000 a month to live off of when she retired. And of course, that would go up each year to keep track with inflation. $1,700 a month was her Social Security estimate. And then she had an airline pension of $1,300. So that's about $3,000 a month between those sources of income, leaving about a $2,000 shortfall.
So I told Diane, I said, hey, tell me, what's the reason you're here? And she said, well, the thing was, back three, four years ago, right before the financial crisis, I had investments with a firm, and when I came in they basically just asked a couple of questions. And the biggest one was, are you a risk taker? Do you mind taking risk, or are you more conservative by nature? She said, I didn't really know how to answer that. I told them, you know what, I don't mind risk. I guess a few friends of mine think I'm more of a risk taker. She said after that they said, great, we've taken care of your investment portfolio.
Well, here's the thing. Because of that answer, they put her in 100% stocks. So Diane went on to say she had had $500,000 in late 2007 in her investment portfolios. After the big selloff, though, she declined to $260,000. That's an almost 50% selloff. And look below that on this slide, because this is the sad part of the story. At the $500,000 level she was at before, that would have provided at least $2,000 a month for her to safely draw out of her investment portfolio without real risk of running out of money prematurely. Now, however, $260,000 would not provide that same income, leaving her with a $1,000 shortfall she was going to have to try to make up in the next few years.
So listen, this is not the right way. Risk tolerance questionnaires, and using that to determine a portfolio allocation, is not the right way to do this. Here in our firm, Sentara Capital, we have a full process where we do a financial plan. And for a lot of people, that means a retirement plan. We take a look at what their assets are, what future income sources are going to be, whether that's Social Security, a pension, or part time income, and most importantly, what their spending needs are going to be. We adjust that for inflation and come up with the right rate of return that's going to allow the client to be able to safely retire without risk of running out of money earlier, and we use that to put in the investment allocation. So, a good story to tell you, because the truth is there are a lot of people out there today whose portfolio is what it is because of how they answered a couple of questions. If that's you, reach out to us. We'd love to talk to you.
All right, let's get back to the markets overview of the first half, and we're going to look back at the first quarter when we had a massive earnings, aka profits, beat in the S&P 500. We talked about this a lot in the first half of the year, so we're not going to spend a lot of time on it. The main takeaway is this. On April 1st, first quarter profits were projected to grow about 13% by analysts for the S&P 500. By the time the quarter was over, or earnings season was over, we had 28.5% profit gains. Tech led the way, up 50%. But we also had industrials, financials, and consumer discretionary all with amazing growth rates of 20% or higher. It was very broad, and a lot of people didn't expect that.
The last piece of good news: we are now in early July. Second quarter earnings reports get started kind of mid July, and we'll talk a lot about them later on. But right now earnings are expected to grow at 23% year over year. It was 16% expected at the start of the year. So we're talking about profits that are really exploding. That's been a huge driver of higher stock prices. It's one of the big reasons stocks could very well be a lot higher by the end of the year than they are today.
All right, two other charts in this segment. One is looking at oil, because that was a huge story earlier in the year. Oil was in the $57 to $58 range for WTI, West Texas crude, and went all the way up to $115 when we had the Middle East conflict. Anyone who was driving around knows gas prices got very, very expensive. Energy costs went up for companies across the board. But of note, once we got from late May to the end of June, oil prices just plummeted. Even though we didn't have official resolution in the Middle East, they're sitting right around $70 to $71 a barrel right now. And this is a big deal, because a lot of analysts, oil analysts mind you, a month or two months ago said oil may not go back anytime soon to where it was before the conflict. They said it could stay in the $80s and $90s all year long. This is very good news that it has not happened.
Now, the last chart in this segment. We're talking about interest rates. We don't want to put anybody to sleep with this, but this matters, because the 10 year Treasury rate has been bouncing around for the last year and a half between 4% on the low end and 4.5% to 4.6% on the high end most of the time. A lot of analysts want to see this go to 4% and break below it, because that will lower rates when corporations are trying to borrow. And also for housing, it'll bring mortgage rates down. The 30 year mortgage rate right now is 6.5%, which is just not good news for housing. Housing has had a tough year so far. We are at 4.48%, as you can see there, right beside it. So in the back half, it's going to be very important to watch this. Does it break higher or lower? We hope for the latter.
Okay, next topic. We're looking at the jobs market. This is very important for the health of the economy. One of the big stories last year in 2025 was that finding a job was not easy to do. What we have in front of you is, over the last year, what the monthly jobs number was. And in blue is the three month moving average, because the jobs number bounces around significantly month to month. So the three month moving average gives us a better idea. You can see from July of 2025 through February of 2026, this number was in the negatives more than the positives. That was not good. It made it hard to find jobs. However, starting in March, the market has taken a turn upward, and this is good news. You will see that we are now sitting at 111,000 jobs gained on average over the last three months. There were a lot of people who said the new break even was 50,000. So anything above 50,000 was a real benefit. Under 50 was trouble. So this is safely above that.
It isn't just monthly jobs gained that has been going in the right direction. The next chart has been very key over the last four years. We're talking about initial claims for unemployment insurance, jobless claims. When someone gets laid off, if they can't immediately find a job, they go file for their benefits. This has stayed very low, in a range between around 190,000 and 260,000 over the last three or four years. We've watched this carefully and have said if this starts heading northward and goes up to 300,000, 350,000 or higher, that is going to be bad news for the consumer and bad news for the economy. Well, you can see this has stayed low pretty much all year long. It's at 215,000 last week. That's a very low number, and it tells you companies just are not doing a lot of layoffs.
And why that matters is the next chart we're going to talk about. There's been this fear over the last year that a lot of people have had of AI causing the unemployment rate to skyrocket. Well, the unemployment rate is 4.2%, about where it's been on average over the last two years. We're not seeing a lot of layoffs there. So far there is no sign that AI is causing a lot of layoffs to occur. But I also want to show you this chart, which is an analysis that put companies into two categories: high AI adoption, meaning they're using AI a lot and encouraging their employees to, and low AI adoption. In the companies that have high AI adoption, they have had a 10% increase in worker numbers, meaning they are bringing on more workers, whereas the low AI adoption companies show no change, basically.
Then, for entry level workers, because that's another narrative over the last year, that entry level workers are going to have a hard time, what we've seen here is that the high AI adopters have had a 12% increase in entry level workers, where the low AI adoption companies show almost no change. So this is a big, big deal. We talked a little bit about some of these very topics a couple of weeks back in a video. You can check that out if you want to. We are in the camp that AI is not going to cause significant job loss and a sky high unemployment rate in the next couple of years. We think actually it's going to lead to more prosperity as it starts to get used more and more.
Our final topic here is SpaceX, one of the most anticipated IPOs, initial public offerings, of all time. I have never seen excitement like we saw here. When this came public, it was at $135. It went all the way up to $225 in the first week, as all the people who couldn't get shares all crowded in, and then it has dropped back down to around $148 to $150 recently. We said it's going to be volatile. If you buy shares, expect it, and don't be surprised. Later this year, we'll get IPOs of OpenAI and Anthropic. So it's a big year. This is the update with SpaceX so far.
Okay, so the key takeaways are that the stock market has had a good first half of the year, powered by earnings growth. We have seen oil prices come down. We have seen precious metals like gold and silver come down. And the jobs market has turned around after a tough end to 2025. Listen, if you are new to Sentara Capital, you can go to our website and find out more about us. And if you're like Diane earlier in the story, and you're invested based on a risk tolerance questionnaire, reach out. We'd love to talk to you. Thanks for watching, and take care.


Comments